Posts

Showing posts with the label Clean Data

Recreate PROC FREQ in Python
Image
Mastering Descriptive Tables in Python: A Nod to SAS's PROC FREQ Mastering Descriptive Tables in Python: A Nod to SAS's PROC FREQ The art of data analysis often begins with understanding the landscape of your dataset. In SAS, PROC FREQ has long been the de facto tool for generating descriptive tables. Python, via its Pandas library, offers comparable functionalities albeit with a different approach. This post aims to bridge the gap between SAS's PROC FREQ and Python's Pandas, focusing on generating descriptive tables that are replete with counts, row percentages, column percentages, and overall percentages. A Quick Dive into SAS's PROC FREQ Before we dive into Python, let's understand what PROC FREQ in SAS is capable of. This procedure is immensely powerful for categorical data analysis. It provides easy ways to calculate counts, percentages, and additional statistics with simple syntax. For instance, one might execute: PROC FREQ ...


Mapping Values in DataFrames: An Introduction to Pandas' map Method

Image
Mapping Values in DataFrames: An In-depth Guide to Pandas' map Method Mapping Values in DataFrames: An Introduction to Pandas' map Method Introduction Data transformation is a common task in data analysis and manipulation. One of the frequent requirements is to replace or map values in a series or DataFrame based on a given relationship or logic. The Pandas library in Python offers a powerful method for this task, known as map . Understanding the map Method The map method allows us to substitute each value in a Series with another value. This can be achieved using a function, a Series, or a dictionary that contains the mapping relationships. Example: Mapping Cities to Regions Consider the following DataFrame containing information about cities in North Carolina, their respective states, attendance figures, and coordinates. import pandas as pd data = { 'City': ['Charlotte', ...

dropna

Image
Working with Missing Data in Pandas Working with Missing Data in Pandas In this blog post, we will explore various techniques for handling missing data using the Pandas library in Python. Specifically, we will focus on removing rows or columns with NaN or None values using different methods provided by Pandas. Setup We begin by importing the required libraries and reading the CSV file containing the movie data. import pandas as pd import numpy as np loc = 'https://raw.githubusercontent.com/aew5044/Python---Public/main/movie.csv' m = pd.read_csv(loc) Creating a Subset and Introducing Missing Values We create a subset of the data, keeping only the columns we want to work with. Additionally, we introduce NaN values in specific rows and columns. m1 = m[['movie_title','director_name','actor_1_name']][0:5] m1.loc[0:1,'director_name'] = np.nan m1.loc[0:2,'actor_1_name...

Fun Function Friday!!!

Image
My Random Function: Count and Percent The other day I was working on a project to simply count and give me the total percent count. First I started with the data.  The Data: import pandas as pd from itertools import combinations data = { 'id': list(range(1, 21)), 'course': ['Math', 'Math', 'Bio', 'Chem', 'Bio', 'Math', 'Chem', 'Bio', 'Chem', 'Math', 'Bio', 'Chem', 'Math', 'Math', 'Bio', 'Chem', 'Bio', 'Math', 'Chem', 'Math'], 'building': ['A', 'B', 'A', 'B', 'B', 'A', 'A', 'B', 'B', 'A', 'A', 'B', 'A', 'B', 'A', 'B', 'B', 'A', 'A', 'B'], 'room': [101, 102, 101, 102, 103, 101, 104, 103, 102, 101, 105, 106, 107, 108, 109...

f'{strings}' are so useful!!!

Image
Unraveling Python's String Formatting Syntax Python, an incredibly versatile programming language, offers a rich array of features. One of them is the string formatting syntax. This capability enables us to insert various objects, often other strings, directly into our strings. >>> name = "Andrew" >>> print(f"My name is {name}. What's your name?") My name is Andrew. What's your name? This mechanism doesn't just stop at simple insertions; it also allows the embedding of expressions within these strings. >>> name = "Andrew" >>> print(f"{name}, which starts with {name[-1]}") Andrew, ends with w Beyond this, Python's string formatting syntax provides tools to control the formatting of each inserted string component, lending your code an even greater degree of flexibility and precision. At first glance, Python's string formatting syntax may appear quite complex, with a myriad ...

Aggregation in Series Methods

Image
Introduction to Aggregation Methods on Series Data in Python Python, along with its robust libraries like Pandas, NumPy, and others, provides an efficient and effective platform for handling and manipulating series data. One of the key techniques that is often used when dealing with this type of data is "aggregation". Aggregation refers to any process where values of multiple rows are grouped together to form a single summary value. Today, we are going to explore ten common aggregation methods you can use with Python. Common Aggregation Methods in Python Sum: Adds up all the values in the series. Mean: Calculates the average of the series. Median: Finds the middle value of the series. Mode: Returns the most common value in the series. Min: Returns the smallest value in the series. Max: Returns the largest value in the series. Count: Returns the number of non-null values in the series. Std: Calculates the standard deviation of the series. Var:...

Pandas Groupby and Agg

Image
Understanding Groupby and Agg in Pandas for Group-wise Analysis Hello, data enthusiasts! Today, we are delving into one of the most useful functionalities in Pandas: the groupby and agg methods. We will particularly look into counting IDs and calculating the percent of total for various groupings in our data. Grouping in Pandas Pandas' group_by method is highly powerful. It allows us to split our data into separate groups to perform computations for better analysis. Let's consider a DataFrame 'df' with columns: 'id', 'course', 'building', and 'room'. import pandas as pd # Suppose df is your DataFrame print(df.head()) You might see something like this: | | id | course | building | room | |---|----|--------|----------|------| | 0 | 1 | Math | A | 101 | | 1 | 2 | Math | B | 102 | | 2 | 3 | Bio | A | 101 | | 3 | 4 | Chem | B | 102 | | 4 | 5 | Bio | B | 103 | Now, say ...

DataFrame groupby agg style bar

Image
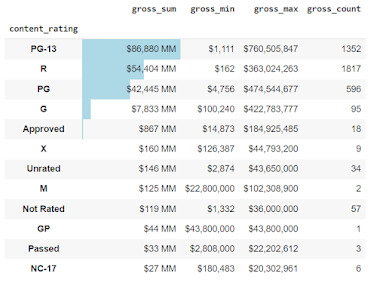
 The goal of the article is to investigate the bar function through the style method of Pandas DataFrame.  So, when we work with DataFrames, we can create a visual within a DataFrame.  What does that mean? We can embed bar charts, sparklines, and mini bar charts in the DataFrame.  This can reduce the amount of cognitive load when reviewing a DataFrame.   Google Colab link with all the code To get started, we are going to import the data: import pandas as pd import numpy as np import pandas_profiling as pp loc = 'https://raw.githubusercontent.com/aew5044/Python---Public/main/movie.csv' m = pd.read_csv(loc) pd.set_option('display.max_columns',None) pd.options.display.min_rows = 10 Next, I want to create a new DataFrame that groups by the rating (e.g., "R" "PG-13"), then calculates the total sum, min, max, and total observations for gross.  content = ( m .groupby('content_rating') .agg({'gross':['sum','min...

drop_duplicates DataFrame

Finding unduplicated lists is task number 1 on day 2, so enjoy this quick review on deduplicating a list based on a few paramaters. This narration discusses uses for drop_duplicates. Usually, drop_duplicates is not used in isolation. There are usually steps before the process. The movies DataFrame has a list of movies with director_name and gross. I first want all movies with a gross above 1 MM, and of those movies, the top-grossing moving by the director.  This is how I would approach the task with pandas and chaining.  First, Import the packages and data: Google Colab space with all the executable code import pandas as pd import numpy as np loc = r'C:\....movie.csv' m = pd.read_csv(loc) pd.set_option('display.max_columns',None) pd.options.display.min_rows = 10 Second, apply the desired steps.  At 1, filter out the unnecessary data.  At 2, sort the values by the director's name and gross amount for the movie.  At 3, drop the duplicates by the dire...

Split

Image
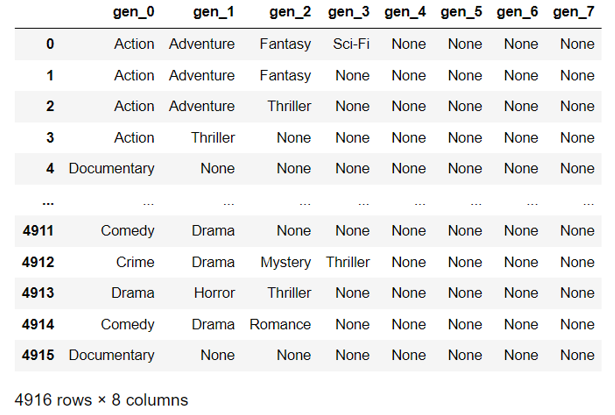
 For this post, I want to look at an amazingly simple, elegant, and useful method – split. The goal is to look at a column and array out all the data based on a delimiter of our choice.  For example, if I have a column containing all the genres of a movie (action, thriller, adventure, etc.) delimited by a “|” I can use split expand =True to accomplish the task:  When we add the chaining method, we end up with the following code: (m      .genres      .str.split('|', expand=True)      .rename(columns=lambda c: 'gen_'+str(c)) ) This gives us a wonderful DataFrame representing a column for each delimited value. In this example, we see eight columns represented by 0 through 7. I wanted to rename the columns with the prefix "gen_" followed by the numeric index.  There we go, we have our columns split out, ready to be joined back to our original table (if needed).