Posts

Showing posts from December, 2022

DataFrame groupby agg style bar

Image
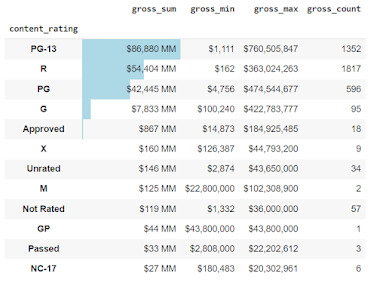
 The goal of the article is to investigate the bar function through the style method of Pandas DataFrame.  So, when we work with DataFrames, we can create a visual within a DataFrame.  What does that mean? We can embed bar charts, sparklines, and mini bar charts in the DataFrame.  This can reduce the amount of cognitive load when reviewing a DataFrame.   Google Colab link with all the code To get started, we are going to import the data: import pandas as pd import numpy as np import pandas_profiling as pp loc = 'https://raw.githubusercontent.com/aew5044/Python---Public/main/movie.csv' m = pd.read_csv(loc) pd.set_option('display.max_columns',None) pd.options.display.min_rows = 10 Next, I want to create a new DataFrame that groups by the rating (e.g., "R" "PG-13"), then calculates the total sum, min, max, and total observations for gross.  content = ( m .groupby('content_rating') .agg({'gross':['sum','min&#

Pandas rank

Image
 The goal of this article is to dive into rank in Python's Pandas. We will rank the total gross of a movie and keep the top most-grossing movies. Google Colab Link import pandas as pd import numpy as np loc = 'https://raw.githubusercontent.com/aew5044/Python---Public/main/movie.csv' m = pd.read_csv(loc) pd.set_option('display.max_columns',None) pd.options.display.min_rows = 10 Now that we have our data, we will walk through ranking movies by the variable gross.  Below is my first attempt.  I wanted to chain everything together to be as efficient as possible - which I define as ease of reading and debugging, don't make a bunch of DataFrames between analysis steps, and accuracy, of course.  Below is my first attempt. I wanted the top ten grossing movies from the movies DataFrame.  So, I created a variable called ranked at #1.  I knew I wanted to query in the same chain, so I created a lambda function so the column/variable is usable immediately.   ( m .as

drop_duplicates DataFrame

Finding unduplicated lists is task number 1 on day 2, so enjoy this quick review on deduplicating a list based on a few paramaters. This narration discusses uses for drop_duplicates. Usually, drop_duplicates is not used in isolation. There are usually steps before the process. The movies DataFrame has a list of movies with director_name and gross. I first want all movies with a gross above 1 MM, and of those movies, the top-grossing moving by the director.  This is how I would approach the task with pandas and chaining.  First, Import the packages and data: Google Colab space with all the executable code import pandas as pd import numpy as np loc = r'C:\....movie.csv' m = pd.read_csv(loc) pd.set_option('display.max_columns',None) pd.options.display.min_rows = 10 Second, apply the desired steps.  At 1, filter out the unnecessary data.  At 2, sort the values by the director's name and gross amount for the movie.  At 3, drop the duplicates by the director

Split

Image
 For this post, I want to look at an amazingly simple, elegant, and useful method – split. The goal is to look at a column and array out all the data based on a delimiter of our choice.  For example, if I have a column containing all the genres of a movie (action, thriller, adventure, etc.) delimited by a “|” I can use split expand =True to accomplish the task:  When we add the chaining method, we end up with the following code: (m      .genres      .str.split('|', expand=True)      .rename(columns=lambda c: 'gen_'+str(c)) ) This gives us a wonderful DataFrame representing a column for each delimited value. In this example, we see eight columns represented by 0 through 7. I wanted to rename the columns with the prefix "gen_" followed by the numeric index.  There we go, we have our columns split out, ready to be joined back to our original table (if needed).  

Exploratory Data Analysis

Image
Exploratory Data Analysis (EDA) Situation: I’m at a new analyst job, and I’m given access to a new database. What next? Do I wait for a data request?  Do I wait for a random task from my boss? Do I review established reports?  What do I do? I just started a new job in February of 2022. Every day I continually see new datasets, inherit established code, and update old code.  I like to ask open questions: What does each row represent? What are the main “filter” columns? What are the data types? How did the last analyst handle the data? Each list of questions and associated processes are unique to each person and the tasks at hand.  By now, this process is second nature. The purpose of this blog is to learn about Pandas. How  would I approach this in Pandas? Let's dig in! Assumptions, I have access to the table. In this example, m associated with movies as a DataFrame  First, I want to look at everything. The describe method is a method to quickly look at everything in the

Filtering Data With Masking

Image
  Goal: Filter DataFrames Filtering data is required for every data analysis project.  The majority of blogs I see only detail how to filter the DataFrame by the row index. It is rare I need to filter on the row index and I don't want to reset the index for every filter. For example, we only want data in the DataFrame where the budget is over $10,000,000, and the director's name is James Cameron.  Well, that is a very specific example, but you get the idea.   There are two general steps (example on Google Colab ) Define the filters/mask Reference the mask(s) between []  I always made the filtering process more difficult than reality.  After looking, and looking, and looking for ways to filter data in pandas, I found a method that meets my expectations.  It must be easy to remember, discuss, and explain to non-programmers.  Also, if another person not all that familiar we Python, they can update the filters as needed, add new ones, and continue on with the analysis. First, we im

PD.CUT

Image
  Goal: Create bins and count observations with PD.CUT For example, I want to count and group when a variable falls between $0 and $1,000,000 and return Bin1, and if the same variable falls between $1,000,001 and $2,000,000, return bin2.   Fortunately, Pandas has a handy little method called cut to determine if the value of a variable falls within the bin.   There are two general ways I want to accomplish this goal: Hard code each bin size (or span - Ex. $0 to $1,000,000) statistically determine the bin population statistically determine the bin span Next, I want to give some nice labels and then group the data by the new column.  All of my code is in Google Colab for demonstration purposes.  First, I want to import the data import pandas as pd import numpy as np loc = 'https://raw.githubusercontent.com/aew5044/Python---Public/main/movie.csv' m = pd.read_csv(loc)   Second, I want to detail bin sizes and create labels. This is where the magic happens! We went to create bins an