Posts

Showing posts with the label agg

Recreate PROC FREQ in Python
Image
Mastering Descriptive Tables in Python: A Nod to SAS's PROC FREQ Mastering Descriptive Tables in Python: A Nod to SAS's PROC FREQ The art of data analysis often begins with understanding the landscape of your dataset. In SAS, PROC FREQ has long been the de facto tool for generating descriptive tables. Python, via its Pandas library, offers comparable functionalities albeit with a different approach. This post aims to bridge the gap between SAS's PROC FREQ and Python's Pandas, focusing on generating descriptive tables that are replete with counts, row percentages, column percentages, and overall percentages. A Quick Dive into SAS's PROC FREQ Before we dive into Python, let's understand what PROC FREQ in SAS is capable of. This procedure is immensely powerful for categorical data analysis. It provides easy ways to calculate counts, percentages, and additional statistics with simple syntax. For instance, one might execute: PROC FREQ ...
Fun Function Friday!!!

Image
My Random Function: Count and Percent The other day I was working on a project to simply count and give me the total percent count. First I started with the data.  The Data: import pandas as pd from itertools import combinations data = { 'id': list(range(1, 21)), 'course': ['Math', 'Math', 'Bio', 'Chem', 'Bio', 'Math', 'Chem', 'Bio', 'Chem', 'Math', 'Bio', 'Chem', 'Math', 'Math', 'Bio', 'Chem', 'Bio', 'Math', 'Chem', 'Math'], 'building': ['A', 'B', 'A', 'B', 'B', 'A', 'A', 'B', 'B', 'A', 'A', 'B', 'A', 'B', 'A', 'B', 'B', 'A', 'A', 'B'], 'room': [101, 102, 101, 102, 103, 101, 104, 103, 102, 101, 105, 106, 107, 108, 109...

Pandas Groupby and Agg

Image
Understanding Groupby and Agg in Pandas for Group-wise Analysis Hello, data enthusiasts! Today, we are delving into one of the most useful functionalities in Pandas: the groupby and agg methods. We will particularly look into counting IDs and calculating the percent of total for various groupings in our data. Grouping in Pandas Pandas' group_by method is highly powerful. It allows us to split our data into separate groups to perform computations for better analysis. Let's consider a DataFrame 'df' with columns: 'id', 'course', 'building', and 'room'. import pandas as pd # Suppose df is your DataFrame print(df.head()) You might see something like this: | | id | course | building | room | |---|----|--------|----------|------| | 0 | 1 | Math | A | 101 | | 1 | 2 | Math | B | 102 | | 2 | 3 | Bio | A | 101 | | 3 | 4 | Chem | B | 102 | | 4 | 5 | Bio | B | 103 | Now, say ...

DataFrame groupby agg style bar

Image
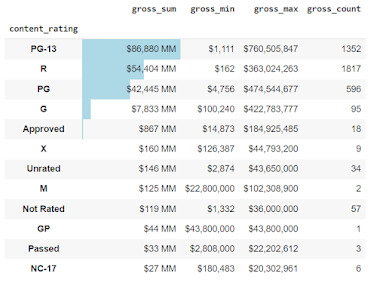
 The goal of the article is to investigate the bar function through the style method of Pandas DataFrame.  So, when we work with DataFrames, we can create a visual within a DataFrame.  What does that mean? We can embed bar charts, sparklines, and mini bar charts in the DataFrame.  This can reduce the amount of cognitive load when reviewing a DataFrame.   Google Colab link with all the code To get started, we are going to import the data: import pandas as pd import numpy as np import pandas_profiling as pp loc = 'https://raw.githubusercontent.com/aew5044/Python---Public/main/movie.csv' m = pd.read_csv(loc) pd.set_option('display.max_columns',None) pd.options.display.min_rows = 10 Next, I want to create a new DataFrame that groups by the rating (e.g., "R" "PG-13"), then calculates the total sum, min, max, and total observations for gross.  content = ( m .groupby('content_rating') .agg({'gross':['sum','min...

Exploratory Data Analysis

Image
Exploratory Data Analysis (EDA) Situation: I’m at a new analyst job, and I’m given access to a new database. What next? Do I wait for a data request?  Do I wait for a random task from my boss? Do I review established reports?  What do I do? I just started a new job in February of 2022. Every day I continually see new datasets, inherit established code, and update old code.  I like to ask open questions: What does each row represent? What are the main “filter” columns? What are the data types? How did the last analyst handle the data? Each list of questions and associated processes are unique to each person and the tasks at hand.  By now, this process is second nature. The purpose of this blog is to learn about Pandas. How  would I approach this in Pandas? Let's dig in! Assumptions, I have access to the table. In this example, m associated with movies as a DataFrame  First, I want to look at everything. The describe method is a method to quickly ...

Recode with np.select

Image
Goal: Create a new column based on data from another column. Use Pandas.DataFrame and Numpy.select to create the new column.  You can see the full program at  Google Colaboratory There are three basic steps to accomplish the goal.   Define the conditions Define the values Use np.select to apply the conditions and values. First, create a list containing each "condition," then  create a list containing each return v alue.   The goal is to correlate each condition with each value.  What does that mean?  It means if the first condition in the "conditions" list evaluates as True, return the first value in the "values" list.   An error will occur when the lists have different index counts.  For example, if there are five conditions and 4 values.      This condition example below has two useful applications we would be remiss if we didn't take note:   The first is the use of .isnull() == True. The second is th...